-
Dolphin Web SolutionEcommerceIntegrating Power BI into Your E-Commerce Strategy
Integrating Power BI into Your E-Commerce Strategy

Table of Contents
- 1 Introduction
- 2 What Is Microsoft Power BI?
- 3 Key Features of Power BI
- 4 Profitability of Online Shops - What Influences It?
- 5 Benefits Of Power BI In E-commerce
- 6 What Areas Of E-Commerce Are Supported By Power BI?
- 7 What Data In Your Online Shop Will Power BI Help You Analyze?
- 8 Why Is Data Analysis In E-Commerce So Important?
- 9 How To Implement Power BI For Your Online Store:
- 10 Conclusion

Summary :
Power BI gives a decisive edge in the fast-paced world of e-commerce. This article examines how Power BI's data insights may help businesses succeed in quickly changing marketplaces. Making educated judgments gives firms a competitive edge, from comprehending trends to foreseeing developments.
Introduction
In today’s rapid e-commerce environment, data-driven decisions are essential for achieving success and staying competitive. They drive efficiency, agility, and competitiveness. E-commerce companies require a strategic advantage to succeed as digital marketplaces develop quickly. Power BI, a game-changing product that goes beyond raw data and gives organizations access to insights that unlock competitive advantages, enters the picture. In this blog, we delve into the integration of Power BI E-Commerce strategy, illuminating how harnessing data insights can be the differentiator in navigating the dynamic and fiercely competitive terrain of fast-moving markets.
What Is Microsoft Power BI?
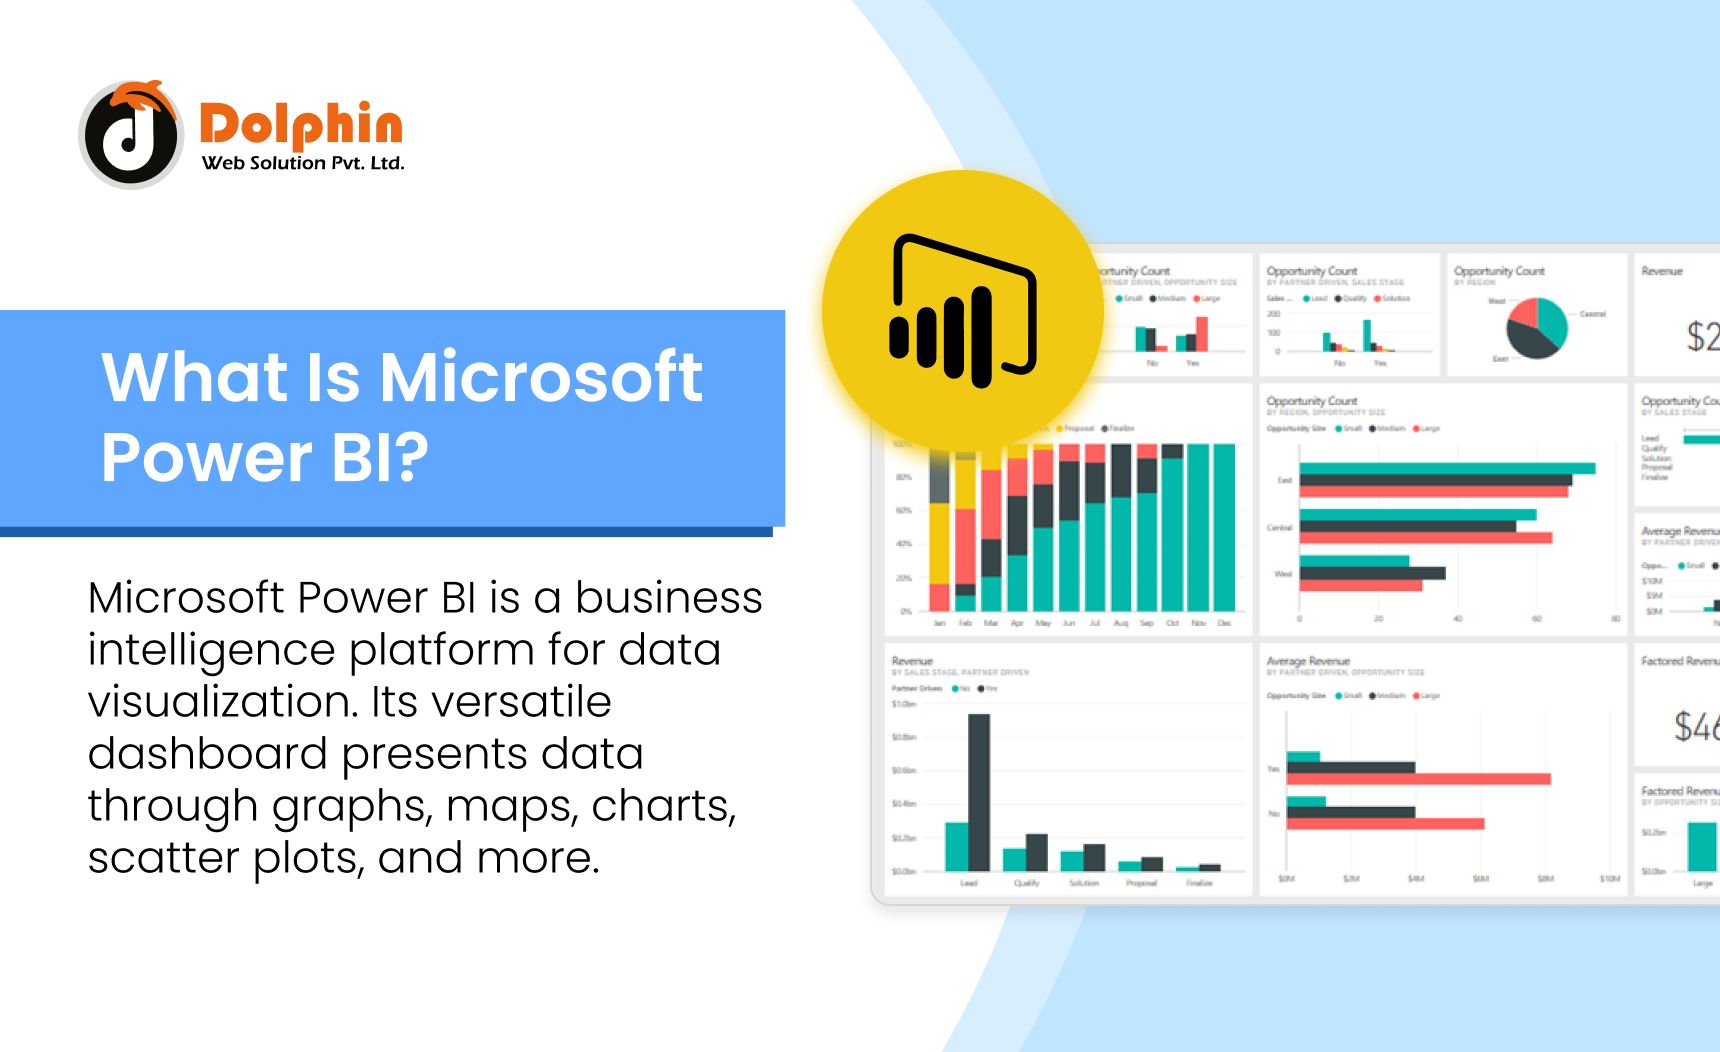
Microsoft Power BI is a business intelligence platform for data visualization. Its versatile dashboard presents data through graphs, maps, charts, scatter plots, and more. It was created to be utilized by business professionals with diverse degrees of data experience. On the other hand, the “AI Insights” feature of Power BI employs artificial intelligence to help users discover insights inside data sets.
Power BI includes Desktop, Pro, Premium, Mobile, Embedded, and Report Server. Pro and Premium offer advanced insights via paid memberships. Microsoft’s Power Platform, encompassing Power Apps, Pages, Automate, and Virtual Agents, integrates with Power BI for data analysis, visualization, automation, and chatbot creation.
Key Features of Power BI
1. A Power BI Interactive Desktop
Power BI Desktop is an accessible, user-friendly tool for data access and report creation. It’s beginner-friendly, requires no technical expertise, and is free to download, making report generation easy and efficient.
2. Individualized Visualization
Every organization has its manner of operating and going about getting things done. Sometimes, the proper course of action is the accepted one. In the case of visualization, the same holds. Due to complicated data, the Power BI tool has a default standard occasionally insufficient for companies. In such cases, businesses may utilize the custom visualization library and create a visualization that meets their requirements. Prefer to read: Microsoft Power BI’s Strongest Benefits.
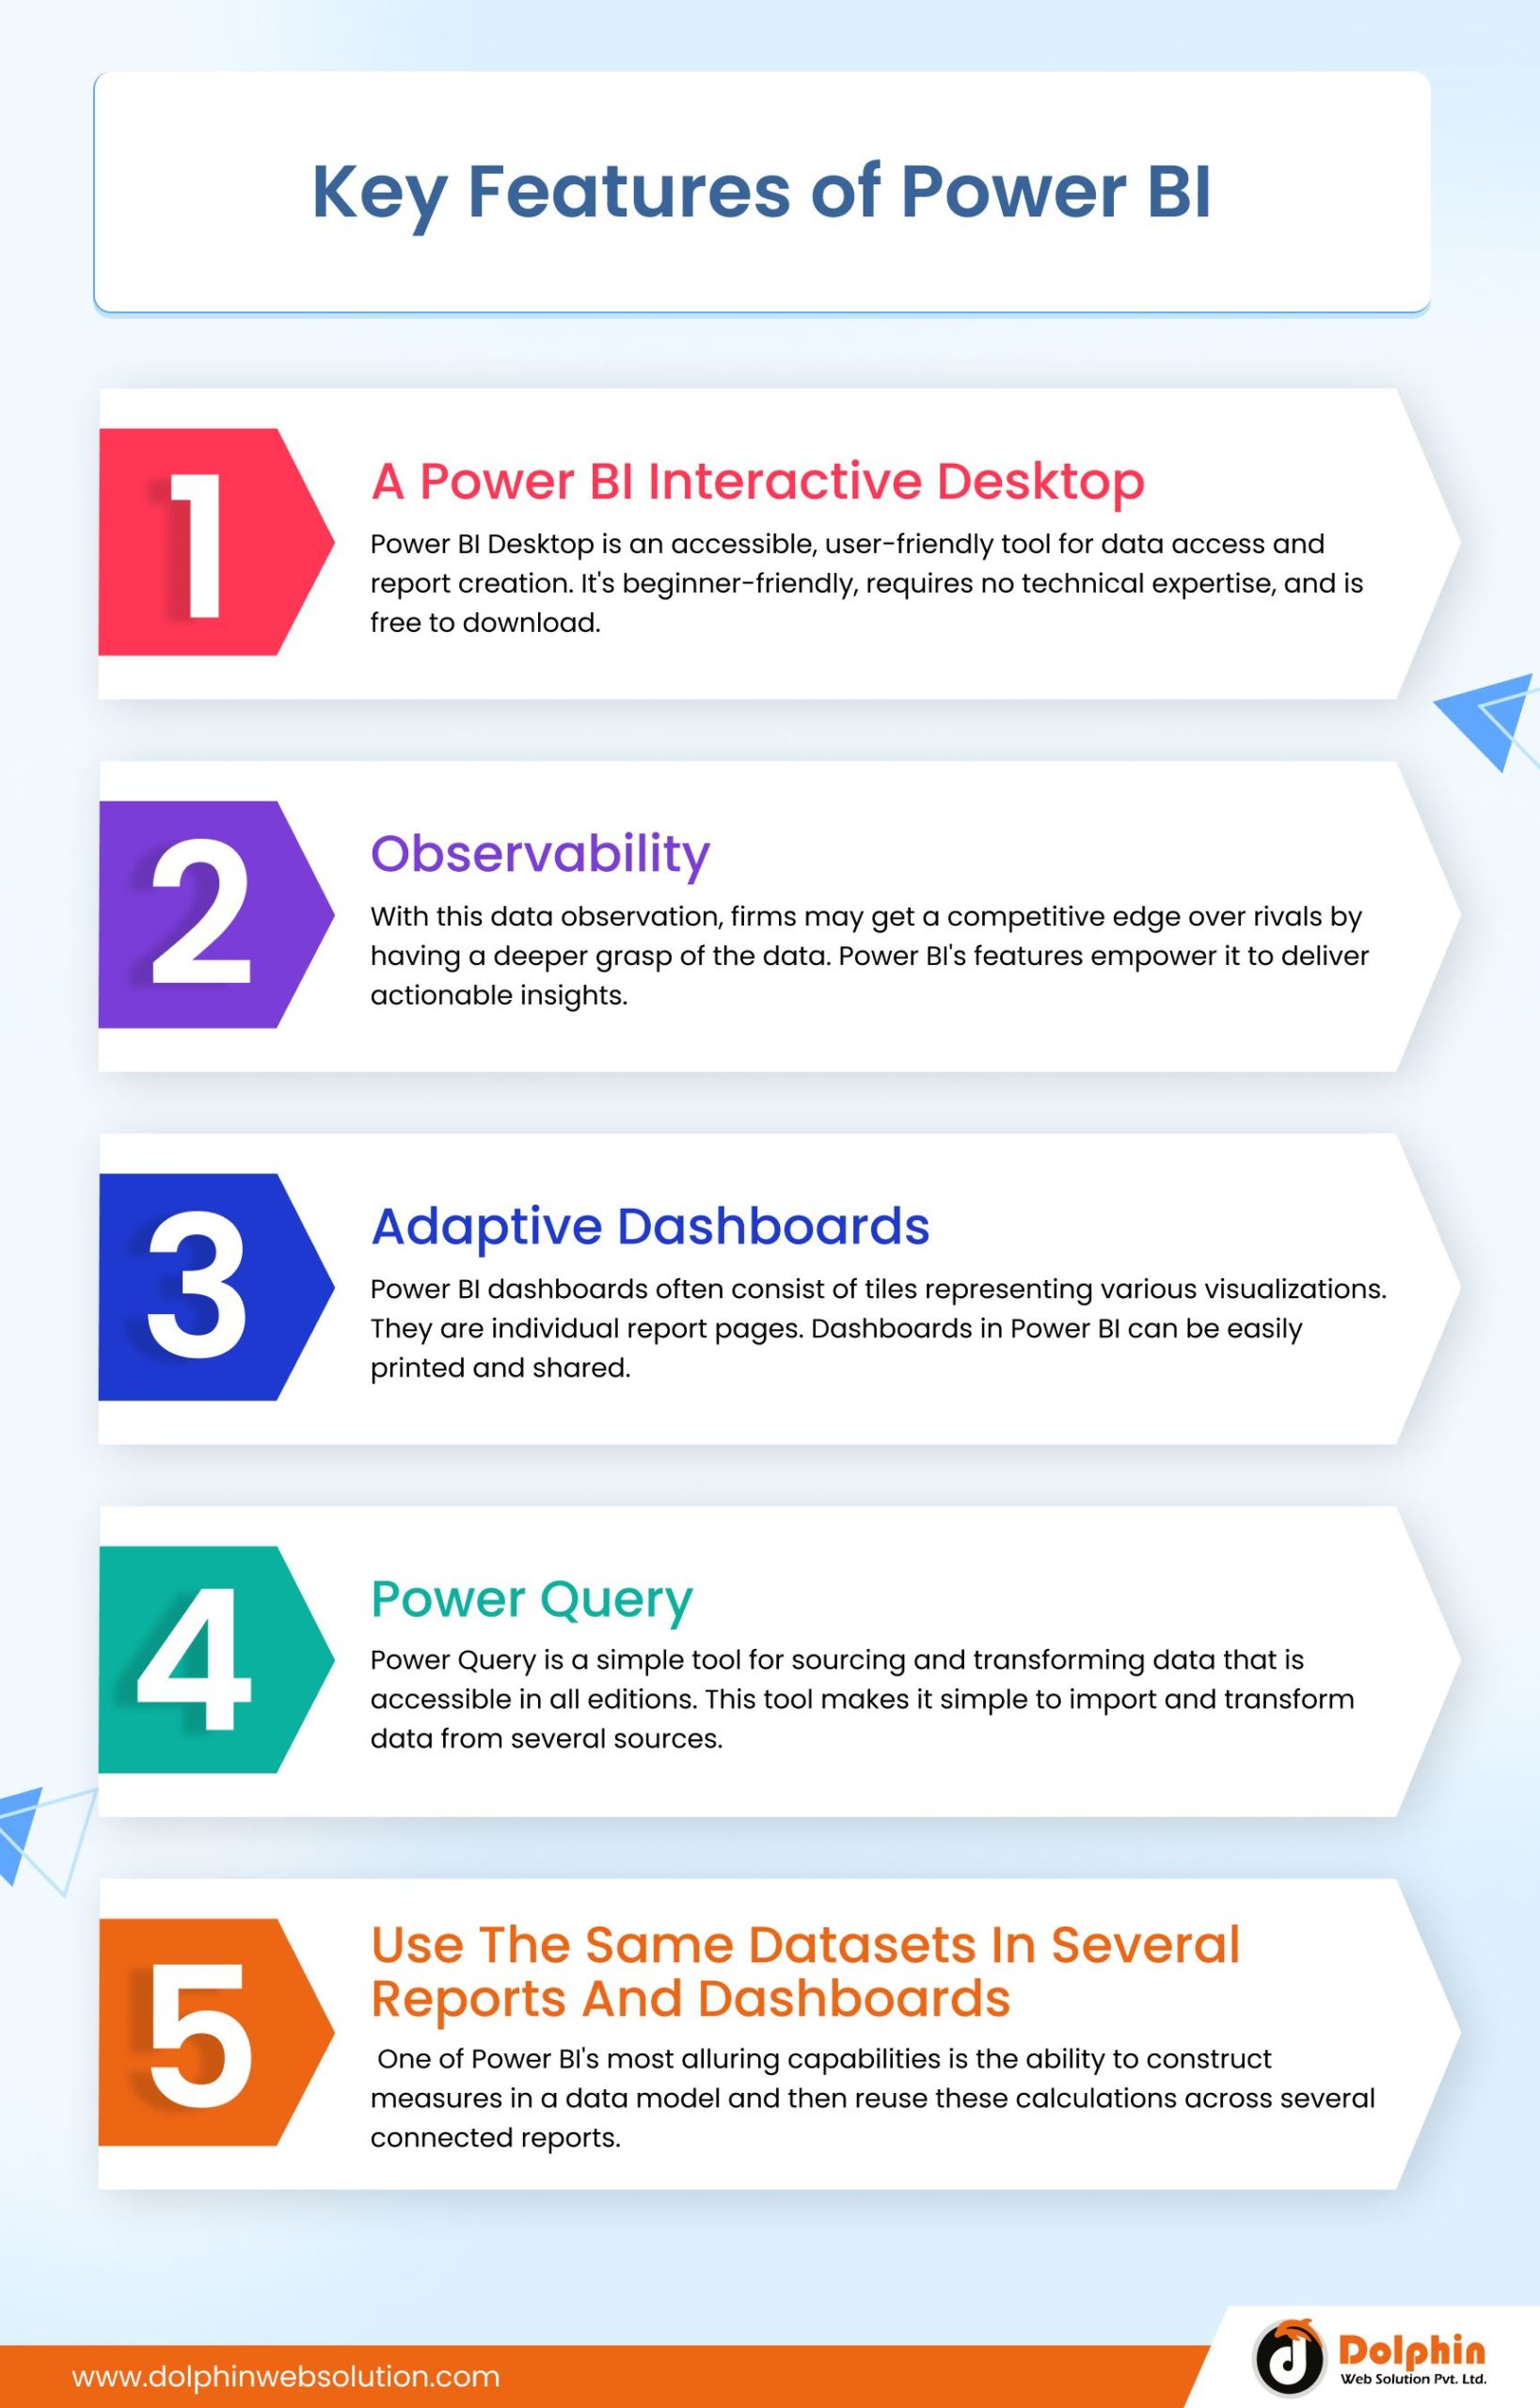
3. Observability
With this data observation, firms may get a competitive edge over rivals by having a deeper grasp of the data. Power BI’s features empower it to deliver actionable insights. Its data integration, modelling, visualizations, and AI capabilities enable effective decision-making and drive business improvements. One technology that makes it possible for data analysis to be speedy, flexible, and user-generated is Power BI.
4. Utilize Excel To Analyze Your Datasets
How to provide flexibility while preserving the integrity of the linked reporting environment has been a problem for BI analysts. Microsoft launched Excel keeping in mind analysis. Users may create tabular and ad-hoc reports using Excel by connecting directly to the underlying Power BI data. When slicing and dicing your data, you may utilize the same datasets referenced in other Power BI reports if you are experienced in constructing PivotTables in Excel.
Finally, users may update their Excel connections to acquire the most recent data from Power BI databases. For enterprises, this accessibility is a game-changer when deciding between platforms, bridging the gap and making data-driven decisions easier.
5. Adaptive Dashboards
Dashboards are collections of visuals that provide insightful or valuable information about data. Power BI dashboards often consist of tiles representing various visualizations. They are individual report pages. Dashboards in Power BI can be easily printed and shared, facilitating seamless communication of vital insights within your organization.
6. Power Query
Simple tool for sourcing and transforming data, is accessible in all editions.
Are you having trouble joining, pivoting, and filtering your data? Using Power Query, Power BI makes it simple to import and transform data from several sources. Power BI is designed for a low/no-code experience, enabling non-technical analysts to seamlessly transform and manipulate data through an intuitive user interface, even without SQL or programming expertise. Alternatively, you may link to on-premises and cloud databases, including SQL Server, Redshift, Snowflake, and BigQuery.
7. Detailed Reports
In Power BI, reports are collections of dashboards with various visuals related to specific business topics. A report displays a thorough and organized presentation of data portrayed in multiple ways while highlighting significant data insights. Users who have developed reports on Power BI may quickly share them with other users.
8. Natural Language Question & Answer Section
One unique feature of Power BI is the Natural Language Q&A, or question and answer box. A user may utilize the Q&A box to search for data and information in the Power BI system by posing inquiries in natural language. The user may search for data, a visualization, or a specific report section using Power BI’s cognitive engines, and those results will be returned. Rephrasing, autofill, recommendations, and other similar approaches are used by cognitive technology to meet user search needs.
9. Use The Same Datasets In Several Reports And Dashboards
It’s a difficult task to get all of your reports to agree on one version of the truth, and it frequently results in metrics and KPI definitions that aren’t consistent. One of Power BI’s most alluring capabilities is the ability to construct measures in a data model and then reuse these calculations across several connected reports. No matter what information you’re reading, you can ensure that “Gross Profit” and “Sales Revenue” provide identical values by specifying your KPI calculations in core datasets.
10. Navigation Pane
Reports, dashboards, and dataset options are available in the navigation pane. Users may efficiently work with Power BI and switch between datasets, their current dashboard, and the reports they are writing.
Also Read:
Top 5 Ecommerce CMS to Start a WebsiteProfitability of Online Shops - What Influences It?
The $4.5 trillion e-commerce business is expected to increase quickly by 2021. Success depends on variables, including product choice, user experience (UX), marketing, logistics, service quality, data analytics, price, security, mobile optimization, and market research.
1. Product Selection Availability
An extensive product selection is one of the main variables affecting an e-shop’s profitability. Customers like having access to everything they require in one location. To match client expectations, e-commerce sites should ensure their vast selection and offers are updated often.
2. Effective Client Assistance
Excellent customer service fosters loyalty and motivates repeat business. Online stores should thus offer simple access to product information, prompt and courteous service, and adaptable return and complaint procedures. An increase in loyalty and excellent word-of-mouth recommendations result from good customer interactions, directly affecting profitability.
3. Security
During transactions is a crucial concern for online shoppers. Online stores should offer secure payment options, employ data encryption standards, and safeguard customers’ privacy. Conversion rates and overall profitability may suffer from a lack of customer confidence in the store.
4. Website Optimization
Users value a website’s responsiveness and loading time highly. According to studies, more excellent loading times result in more shopping cart abandonments. Online stores should optimize their pages to guarantee visitors have a comfortable and seamless experience.
5. Marketing Plan
A solid marketing plan is essential to draw visitors to your online store. Develop a social media profile, engage in online advertising email campaigns, and employ remarketing tactics. It’s also crucial to keep track of performance and analyze data to adjust the procedure to client preferences and behaviour.
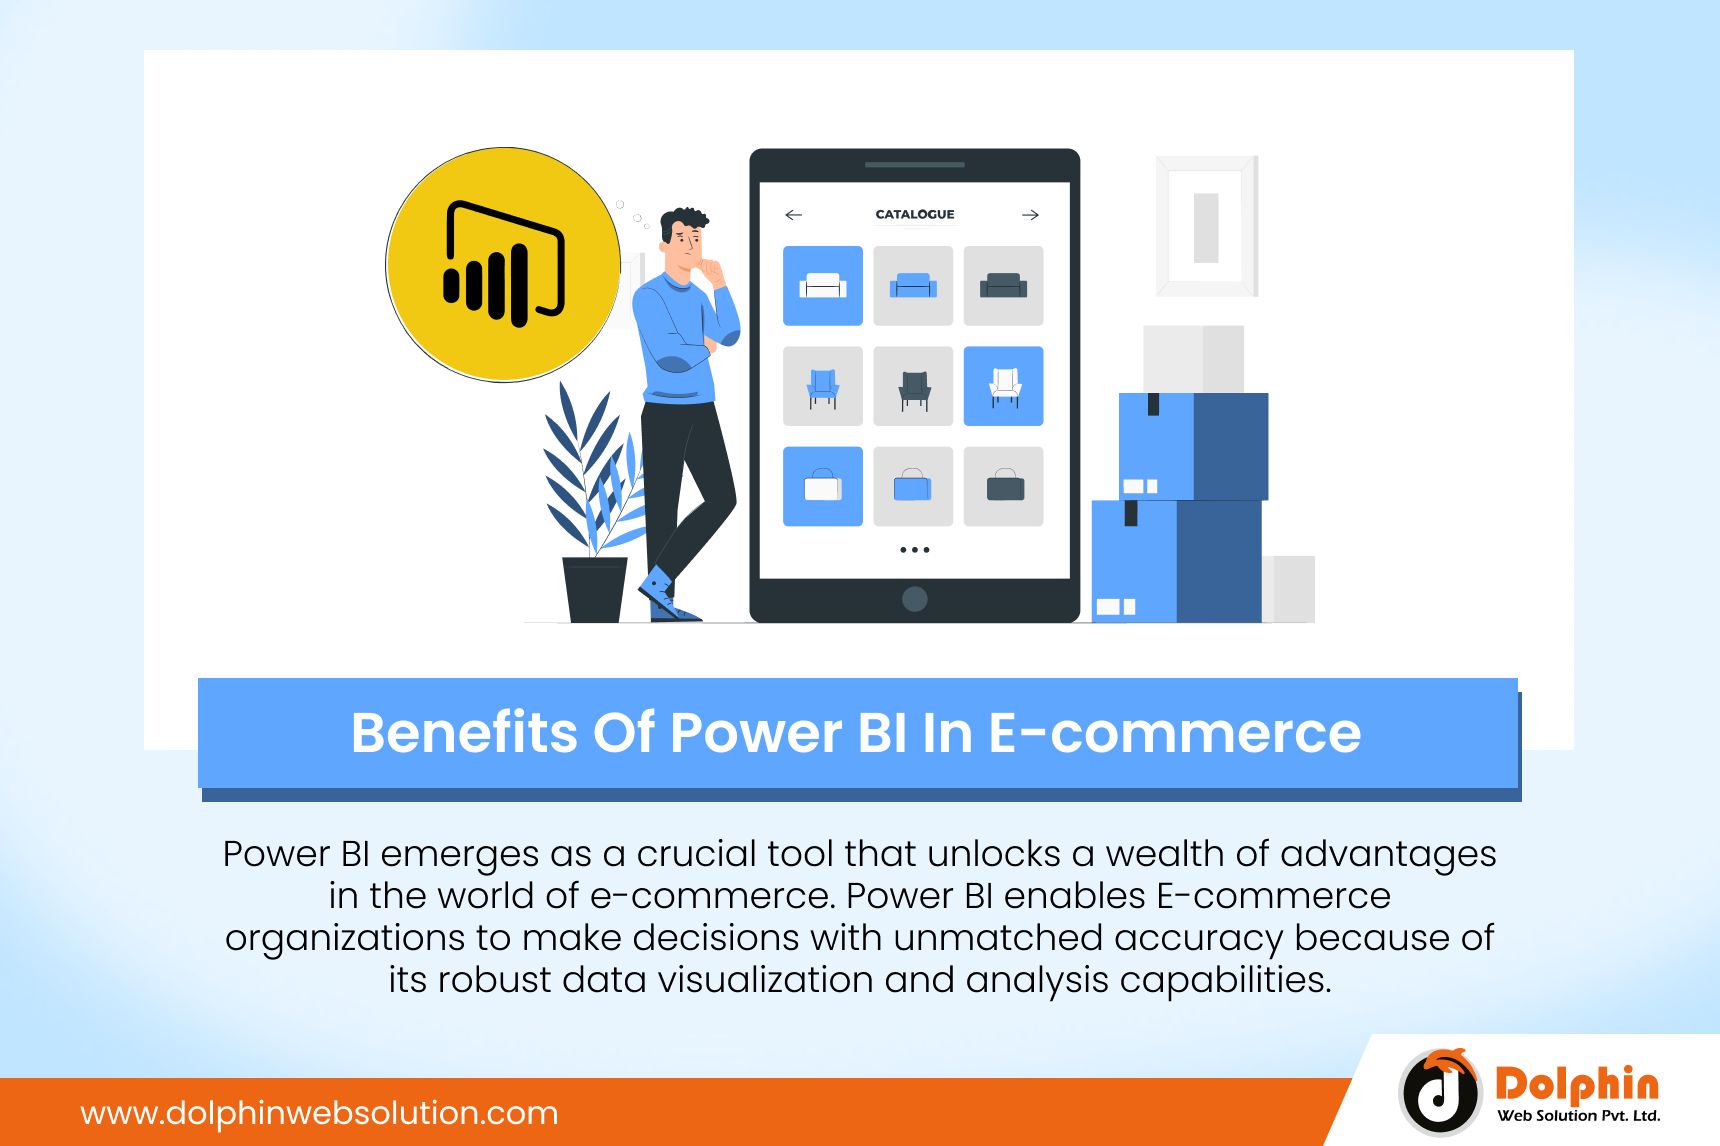
Benefits Of Power BI In E-commerce
Power BI emerges as a crucial tool that unlocks a wealth of advantages in the world of e-commerce. Power BI enables E-commerce organizations to make decisions with unmatched accuracy because of its robust data visualization and analysis capabilities. Power BI offers a thorough perspective of operations by seamlessly combining data from numerous sources, including sales, customer behaviour, inventory, and marketing campaigns. This improves the comprehension of trends, patterns, and performance indicators.
Thanks to this practical understanding, businesses may recognize sales opportunities, enhance inventory management, and customize marketing campaigns. Operational bottlenecks may be quickly identified and speedy remedial action taken thanks to real-time dashboards and interactive reporting. Furthermore, Power BI’s user-friendly interface makes data available to non-technical stakeholders, encouraging departmental cooperation and well-informed decision-making.
In the end, Power BI’s integration with E-commerce operations results in improved customer experiences, higher operational efficiency, and a competitive edge in a constantly changing digital market.

What Areas Of E-Commerce Are Supported By Power BI?
Anyone who manages an online store knows tracking customer behaviour or website traffic is crucial for expansion. Using the data gathered, we can:
- Find the online store’s traffic sources.
- Be aware of the customer’s age, gender, location, and hours of operation.
- Pick the most efficient avenues for communication and marketing.
- Determine which goods are most profitable for our online business.
- Determine the reason why shoppers abandoned their baskets.
Power BI centralizes and simplifies online store data aggregation, segmentation, analysis, and visualization. It enables accessible, real-time data for all employees, irrespective of location or time. A business intelligence product, Microsoft Power BI, will advance data analytics in your online store. They are accessible from anywhere at any time with the help of the Power BI service, and by utilizing Power BI Mobile, they are also accessible from mobile devices.
What Data In Your Online Shop Will Power BI Help You Analyze?
Sales and revenue data may be analyzed using Power BI to determine sales, revenue, and purchasing behaviour trends. You may evaluate peak sales times, top-selling items, and sources of income by displaying this data, enabling knowledgeable inventory management and focused marketing campaigns.
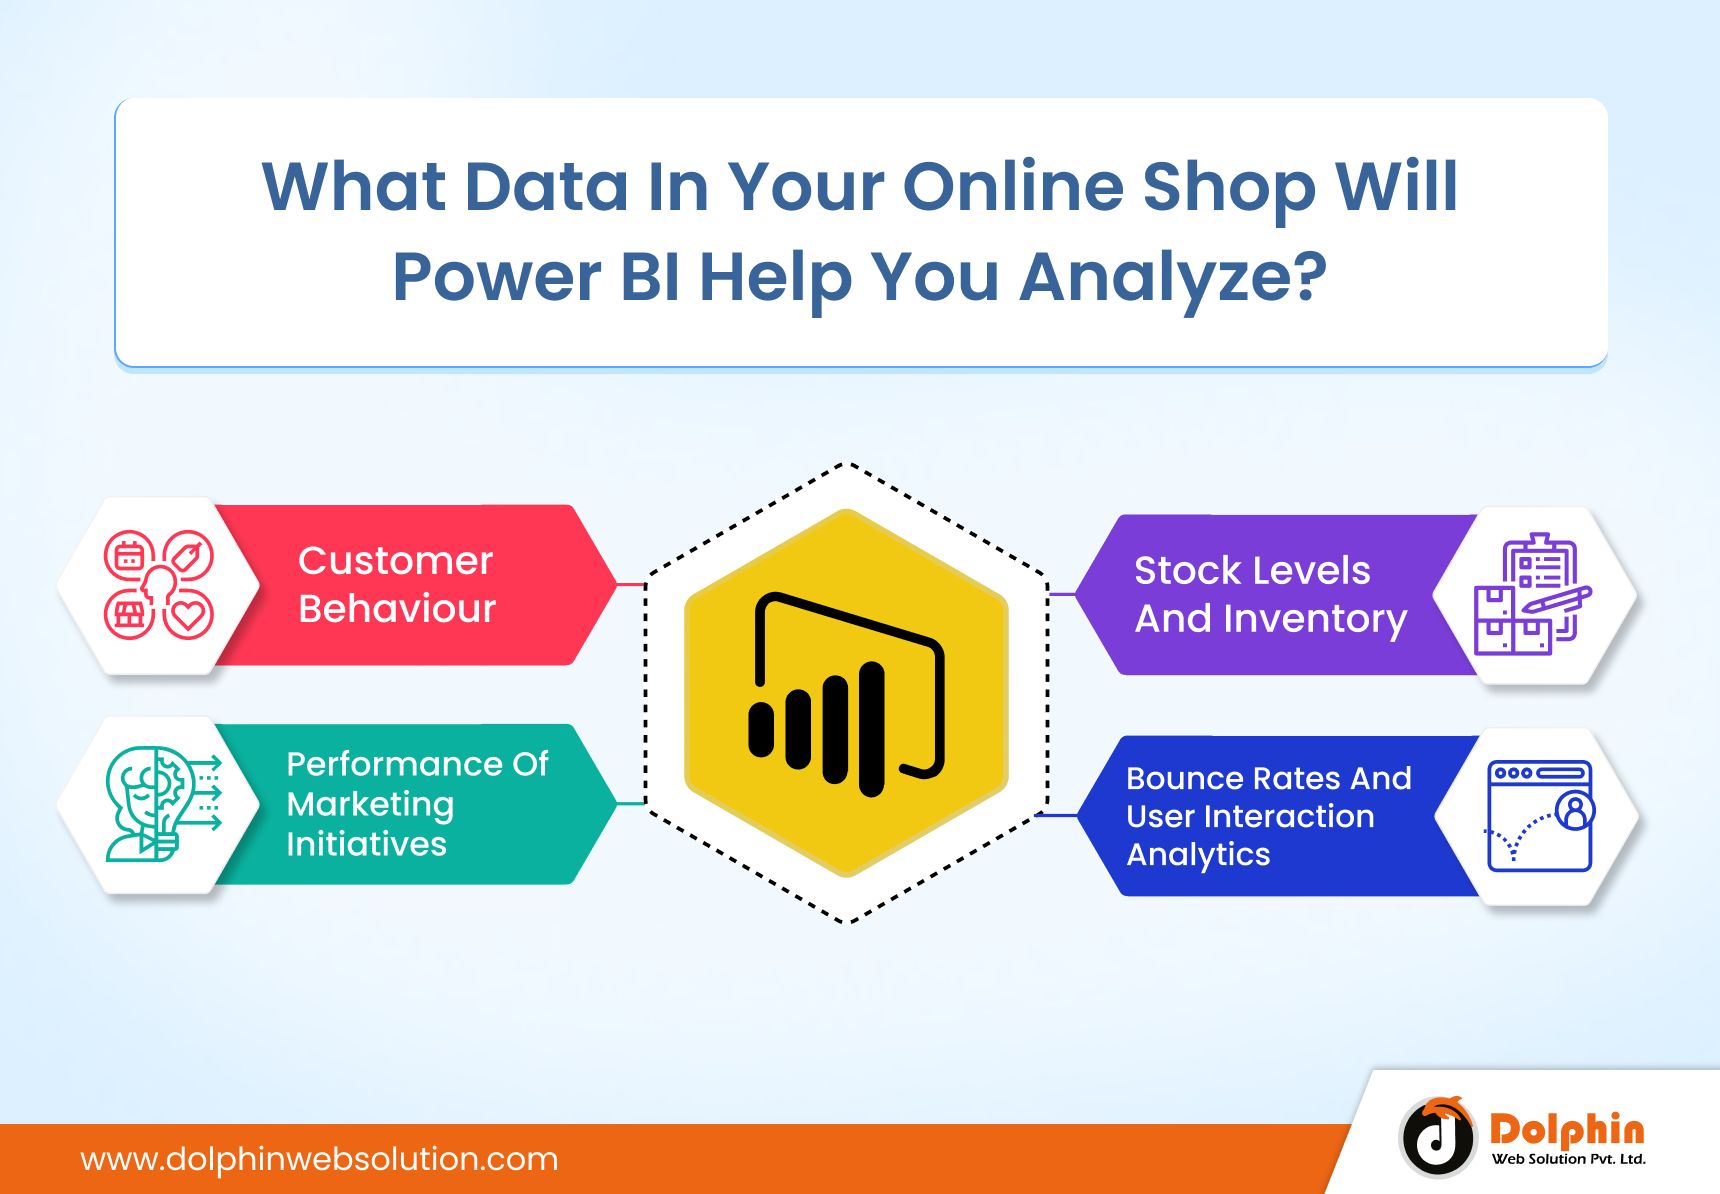
1. Customer Behaviour
Power BI assists in analyzing consumer preferences, interactions, and purchasing patterns. To create tailored experiences, optimize user journeys, and raise customer happiness, it is helpful to understand click-through rates, conversion rates, and customer segmentation.
2. Stock Levels And Inventory
Analyzing inventory data enables the maintenance of ideal stock levels. With Power BI’s help, you can track stock turnover rates, spot slow-moving merchandise, and forecast demand swings to ensure adequate supply chain management and reduce stockouts and overstocking.
3. Performance Of Marketing Initiatives
Power BI assesses the success of marketing initiatives. You may determine which ads resonate most strongly with your audience by monitoring data like click rates, conversion rates, and ROI. This allows you to direct resources toward the most effective techniques.
4. Bounce Rates And User Interaction Analytics
Power BI can examine website traffic and user interaction analytics. You may analyze visitor journeys, discover popular sites, and modify your website’s design and content to improve user experience and engagement by visualizing this information.
Why Is Data Analysis In E-Commerce So Important?
1. Follow A Customer’s Purchasing Process
Understanding people, especially consumers, is essential to doing business. When internet transactions were not every day, and consumers exclusively made purchases in storefronts, tracking down each customer’s background information was not practical. Approximately 2.05 billion individuals purchase items online nowadays. Even though individuals frequently navigate between websites before buying something, browsing activity data may be traced and examined.
Customers’ purchasing journeys may be followed using big data analytics techniques. They record past customer interactions with a company, such as items seen, clicks, prior transactions, etc. The information enables business owners to learn more about and comprehend their customers.
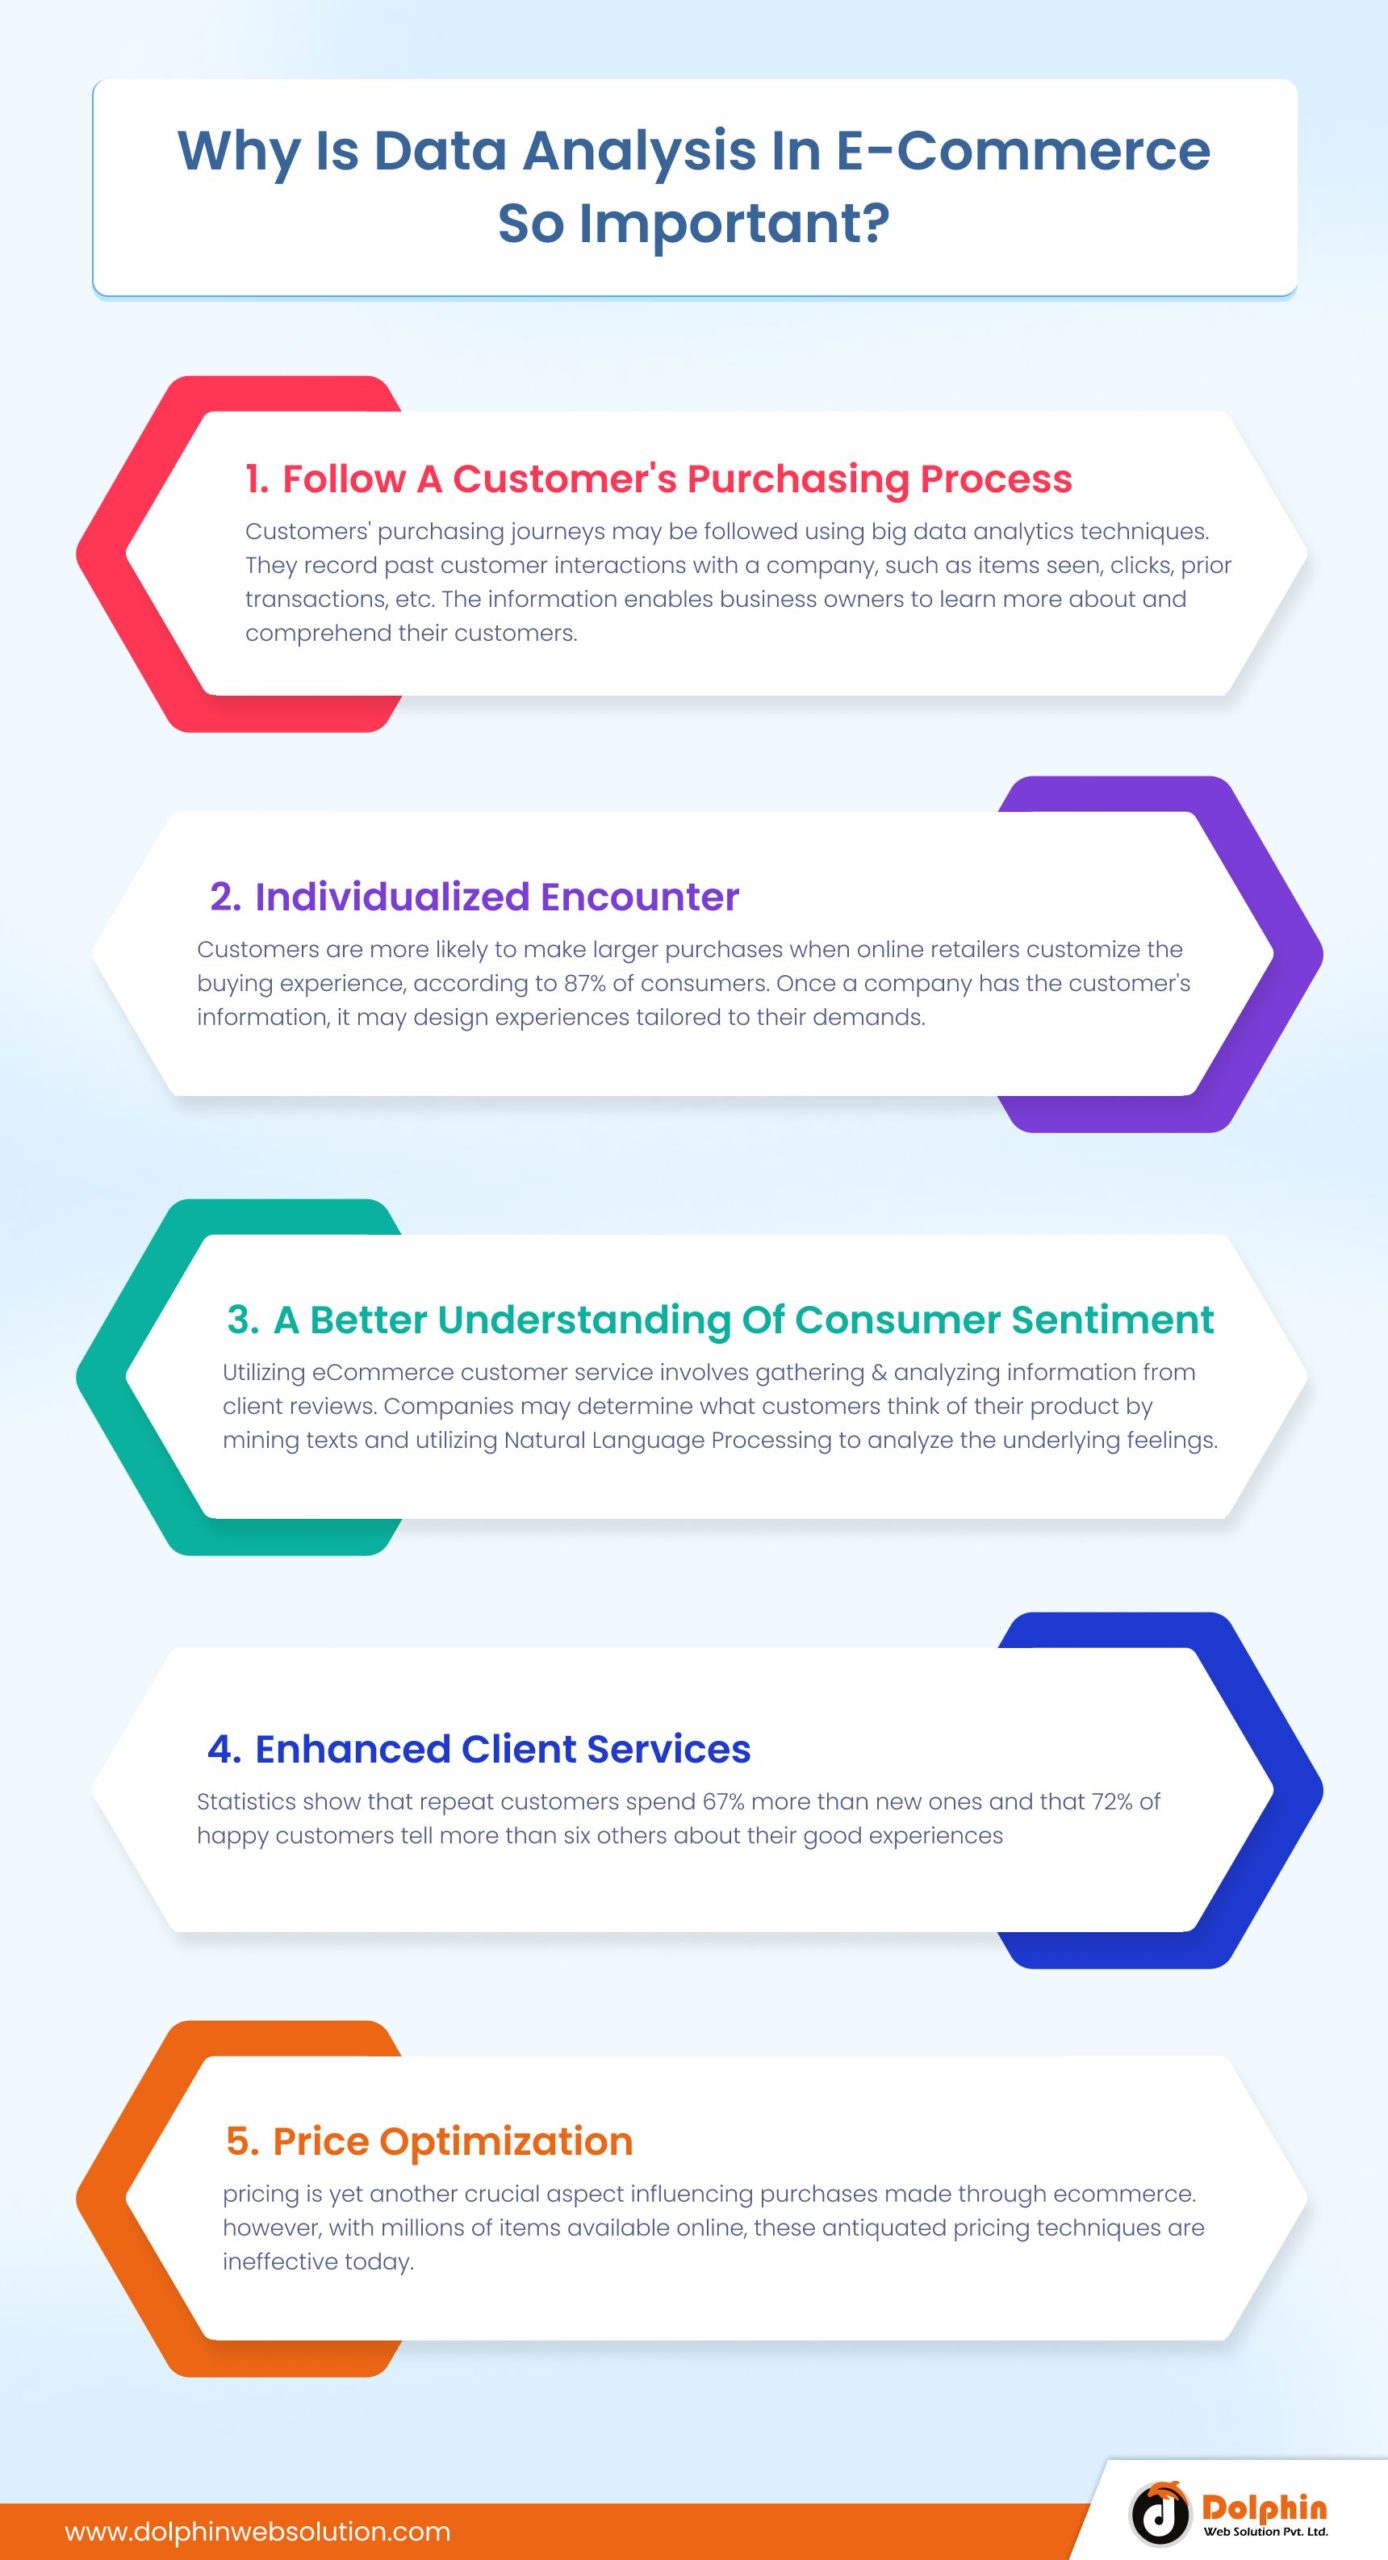
2. Individualized Encounter
Customers are more likely to make larger purchases when online retailers customize the buying experience, according to 87% of consumers. Once a company has the customer’s information, it may design experiences tailored to their demands.
Personalized experience techniques include adopting up-selling and cross-selling strategies to individuals, sending personalized emails to users with unique discounts and offers, displaying targeted advertisements to specific groups of people, etc. The biggest eCommerce company in the world, Amazon, is an excellent example of how to use cross-selling and big data analytics to increase income.
Several suggestion lists were created based on datasets from Amazon’s millions of online shoppers. According to each customer’s browsing history, Amazon makes individualized recommendations, substantially increasing the likelihood that a sale will be made. Although it seems like a little tactic, the ultimate effect is astounding: the product suggestion algorithm accounts for 35% of all Amazon Company income.
3. A Better Understanding Of Consumer Sentiment
Utilizing eCommerce customer service involves gathering and analyzing information from client reviews. For multinational organizations like Unilever, Huawei, and Haier, the Yunting CEM customer data analytics platform gathers reviews and does sentiment analysis. Through eCommerce websites, these businesses sell millions of goods around the globe over hundreds of product lines. Companies may determine what customers think of their product by mining texts and utilizing Natural Language Processing to analyze the underlying feelings. For instance, Huawei’s marketers learn whether customers have favourable, neutral, or negative opinions about the phone’s design, battery life, button size, camera, general functionality, and other characteristics.
Through eCommerce communication platforms like Aliwangwang and JDdongdong, Yunting CEM also gathers conversation data. These communication platforms were created by Alibaba and JingDong, the two most significant Chinese eCommerce giants, as big data analytics tools to help e-store owners engage with customers more effectively. By mining the chat data, E-store owners may quickly determine how interested their consumers are in particular items, what product features they care about most, etc. As a result, they may choose the items’ unique selling proposition and modify their marketing plan.
Also Read:
Top 7 Magento Development Company4. Enhanced Client Services
Have you ever been in the following circumstance: unsure about a product you had just discovered on BestBuy? You spoke with customer service. They addressed your inquiry correctly in a matter of seconds. You were pleased with the merchandise after receiving it, and you told your loved ones about it on social media.
It appears to be a rather typical situation. However, there is enormous commercial potential beneath the surface. Business.com statistics show that repeat customers spend 67% more than new ones and that 72% of happy customers tell more than six others about their good experiences. They can also improve the quality of service and decrease the likelihood of poor service by sending out surveys and collecting customer feedback.
5. Price Optimization
Pricing is yet another crucial aspect influencing purchases made through eCommerce. However, with millions of items available online, these antiquated pricing techniques are ineffective today. Big data analytics technologies allow business owners to view the bigger picture and track rivals’ pricing in real-time. Because the market price is constantly shifting, this calls for a sizable data collection containing the rivals’ pricing.
How To Implement Power BI For Your Online Store:
Data-driven decision-making may be revolutionized for an e-commerce organization by implementing Power BI. With the help of this innovative technology, organizations may gain valuable insights from extensive, complicated information, improving operations and customer experiences.
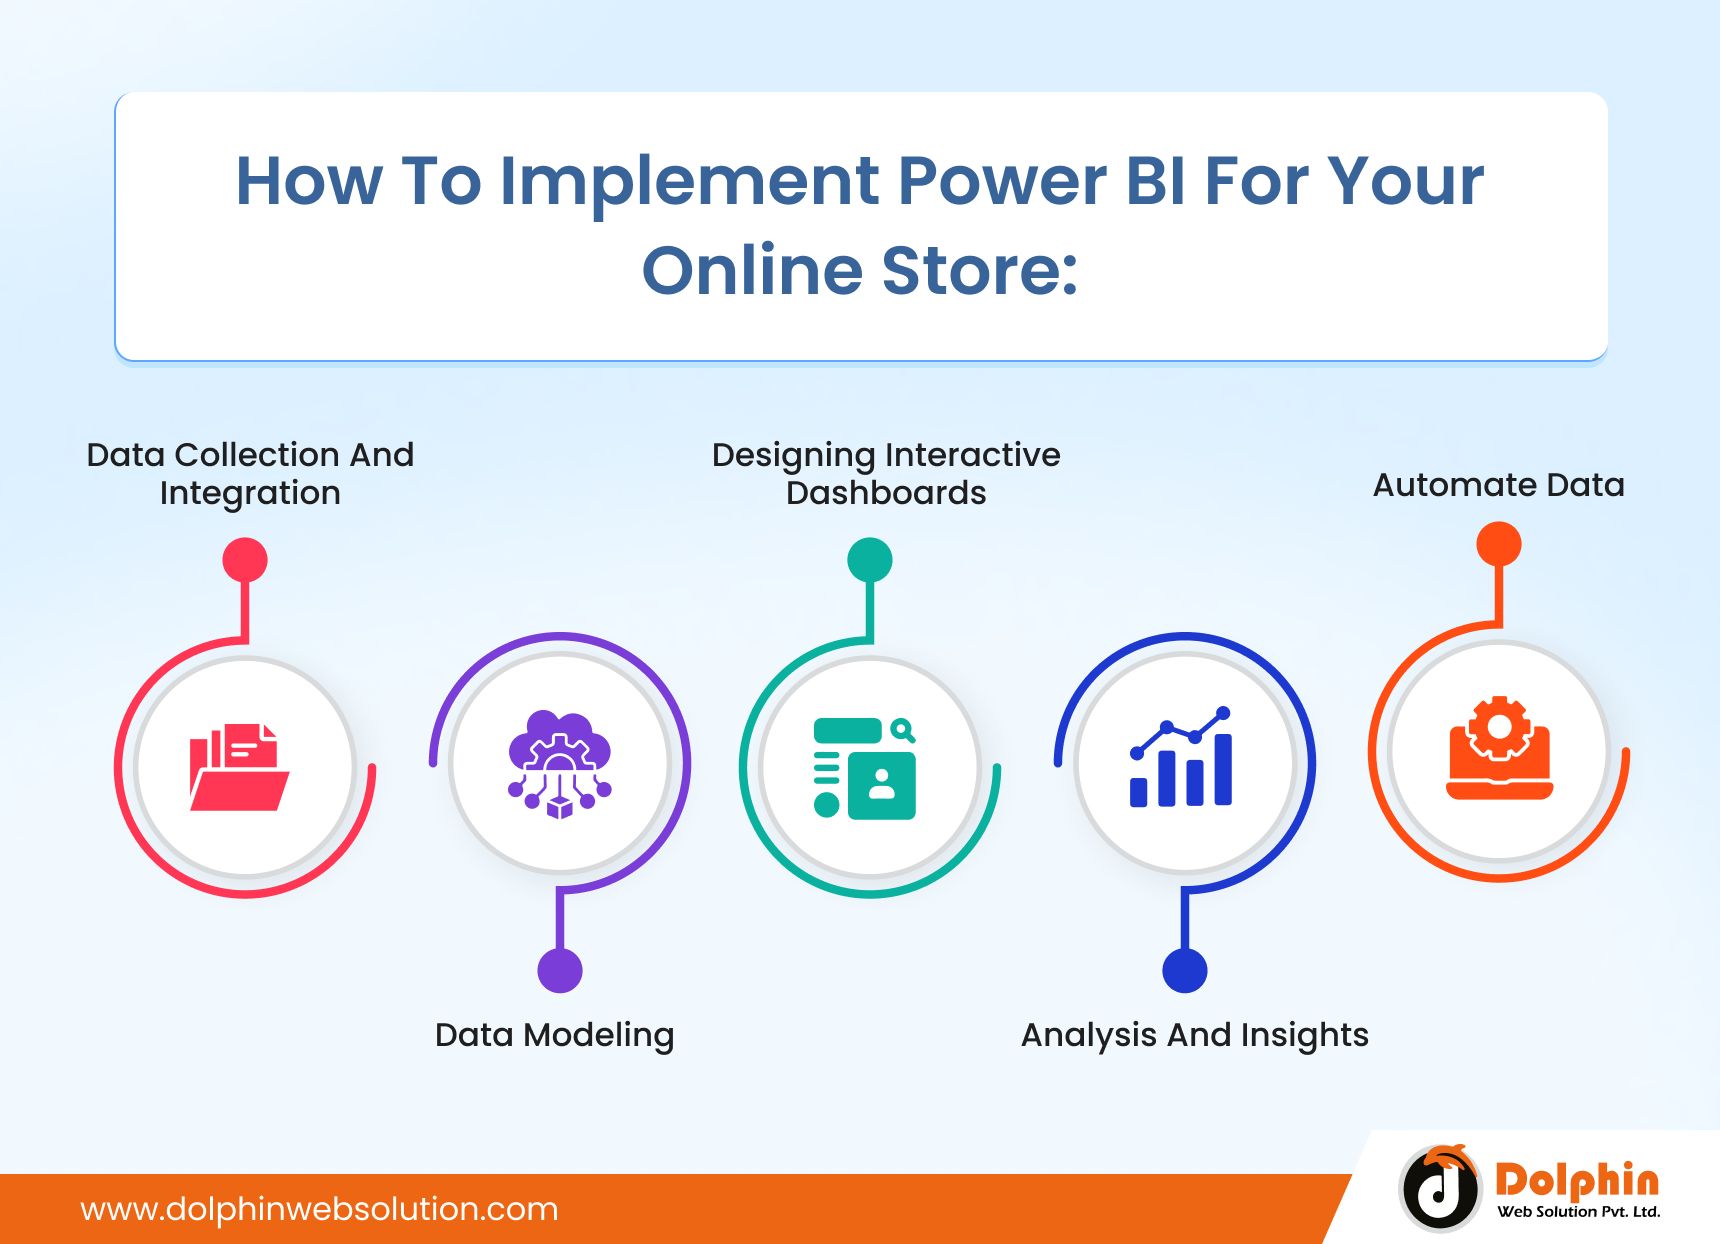
1. Data Collection And Integration
To start, pinpoint the most pertinent data sources, such as sales statistics, consumer trends, and marketing analytics. Create a centralized analysis repository by integrating these dispersed sources into Power BI using connectors or APIs.
2. Data Modeling
Establish linkages, metrics, and computed columns to create a solid data model. This stage ensures accurate data and cohesive visualizations, laying the groundwork for insightful analysis.
3. Designing Interactive Dashboards
Power BI’s drag-and-drop interface is incredibly user-friendly and makes designing interactive dashboards a breeze. To provide a comprehensive picture of sales, customer engagement, and inventory, create visual representations of crucial indicators, such as charts, graphs, and tables.
4. Analysis And Insights
Use Power BI’s analytical capabilities to get wisdom. Analyze consumer patterns, inventory turnover, and sales trends. Determine trends, connections, and openings that direct strategic choices in marketing, product selection, and inventory control.
5. Automate Data
It helps refreshes to retain real-time insights through automation and sharing. Securely publish and distribute dashboards to stakeholders, enabling teams to collaborate and choose based on the most recent data. Review and update dashboards often to reflect shifting business requirements.
Implementing Power BI enables e-commerce organizations to accelerate growth and optimize operations by turning raw data into actionable insight.
Conclusion
Incorporating Power BI becomes a strategic need for organizations hoping to survive and prosper as e-commerce continues its relentless expansion. You can opt for Ecommerce Development Service to easily integrate power BI into your ecommerce. Businesses are better equipped to comprehend trends, foresee changes, and make educated choices that keep up with the pace of the market when data can be transformed into actionable insights. The ones equipped with data insights, thanks to Power BI, are best positioned to outsmart the competition, meet changing customer expectations, and create the success stories of tomorrow’s E-commerce landscape in the race for dominance in fast-moving marketplaces.

Jigar Shah

Jigar Shah leads the operations of Dolphin Web Solution as the Chief Operating Officer(COO). His expertise extends to various aspects of the tech industry, including strategic planning, project management, and innovation implementation. He has consistently delivered results and optimized internal processes for maximum efficiency. Beyond his professional accomplishments, he is also passionate about writing, reading and playing chess.
We can help you with
- Dedicated Team
- Setup Extended Team
- Product Development
- Custom App Development
Our Offices

AHMEDABAD (INDIA)
B- 203-206, Empire Business Hub, Science City Road, Sola, Ahmedabad – 380060

BERLIN (GERMANY)
Badensche Str. 28, 10715 Berlin, Germany

CALIFORNIA (USA)
9601 Reseda Blvd, Apt#223, Northridge CA-91324, USA

ALBERTA (CANADA)
302 Skyview Ranch Drive NE, Calgary, Alberta, Canada T3N0P5


Hello!
Click one of our contacts below to chat on WhatsApp